Melbourne and Singapore: how climate shapes air monitoring and plant stress
Extra information: project timeline, results that didn't fit, what we'd do differently, and the app, data and code.
John Monash Science School · Seara, Shlishta and Ryan
NUS High School of Mathematics and Science · Michael, Myat and Somnath
01The poster
How do the climates of Melbourne and Singapore affect plant stress, and where air-quality sensors should go?
Leaves · John Monash Science School
- Nasturtium leaves kept the same shape in Melbourne-like (52–54%) and Singapore-like (90–96%) humidity over 26 days.
- Dry air caused a short shock in the first week (duller leaves, more leaves lost), but no lasting colour difference.
Sensors · NUS High School
- Placing PM2.5 sensors with the weather in mind made pollution maps 10–50% more accurate when sources are predictable.
- Melbourne didn't benefit more than Singapore: how densely sensors cover a city mattered more.
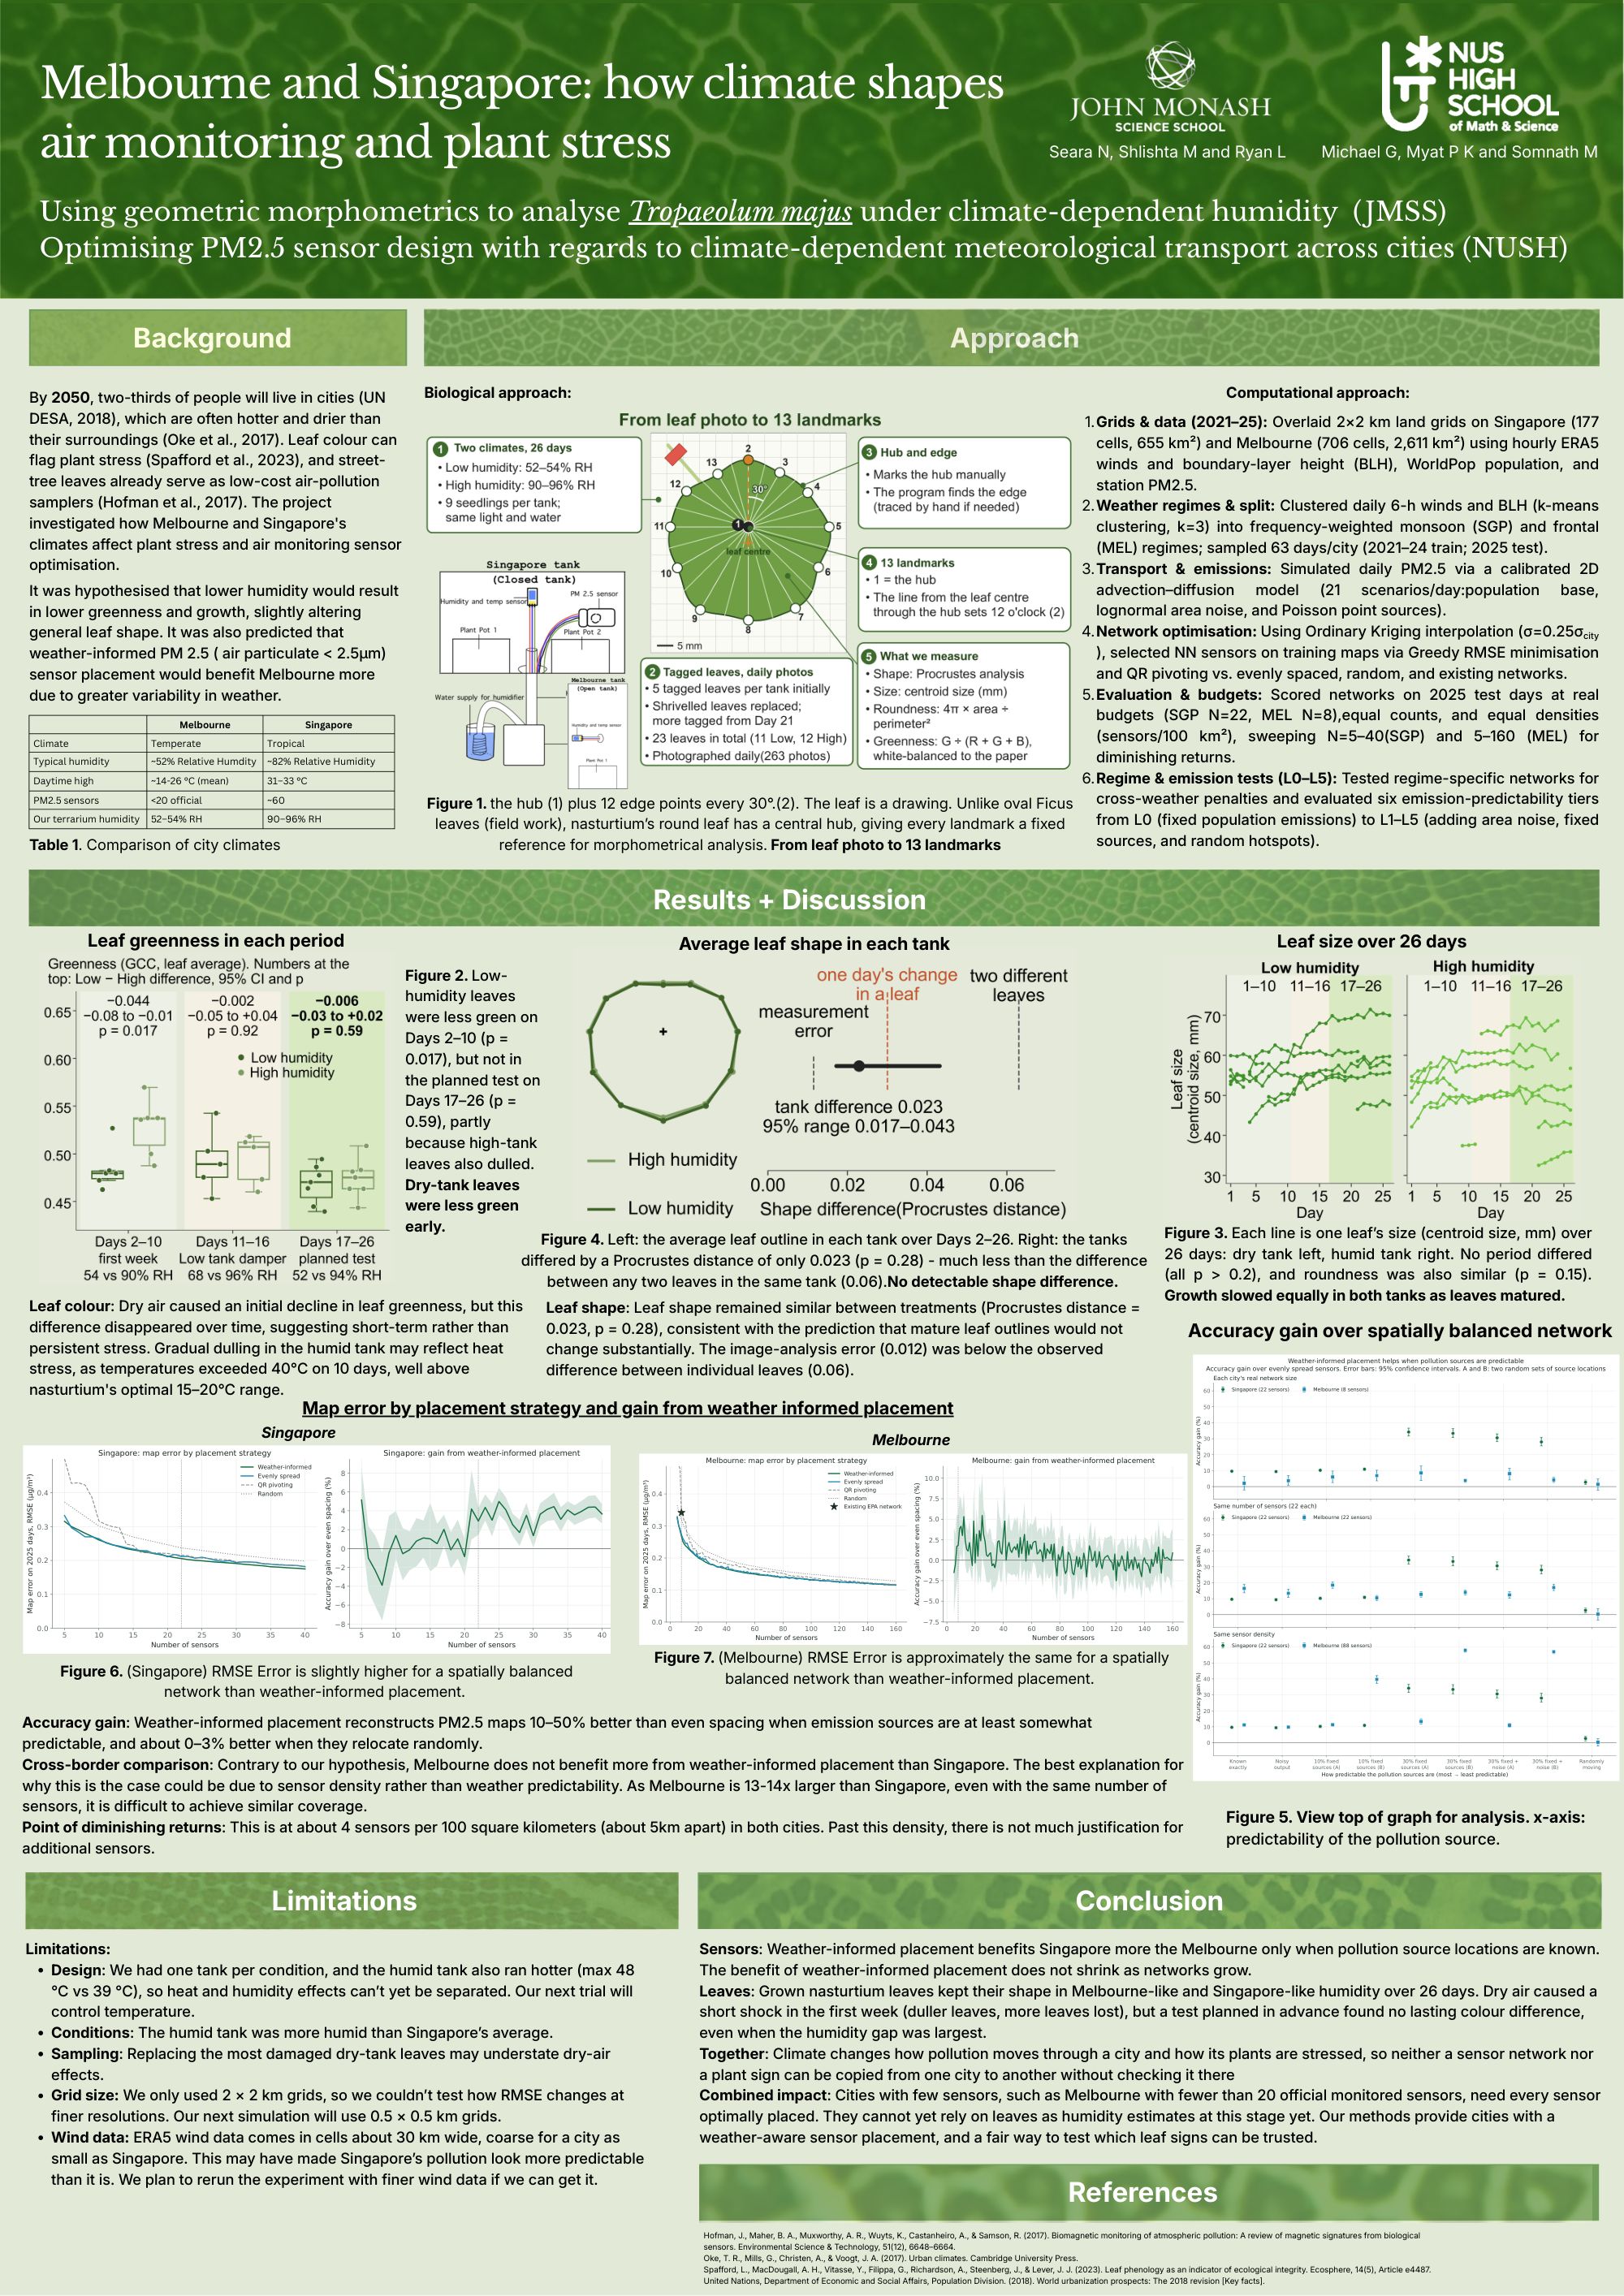 Open the poster (PDF, 3.8 MB)
02Project timeline
- Term 2, 2026Proposal with NUS High. Our first plan was wider around smoke and haze, leaf pores and a laser beam. We narrowed it down to what we could test properly.
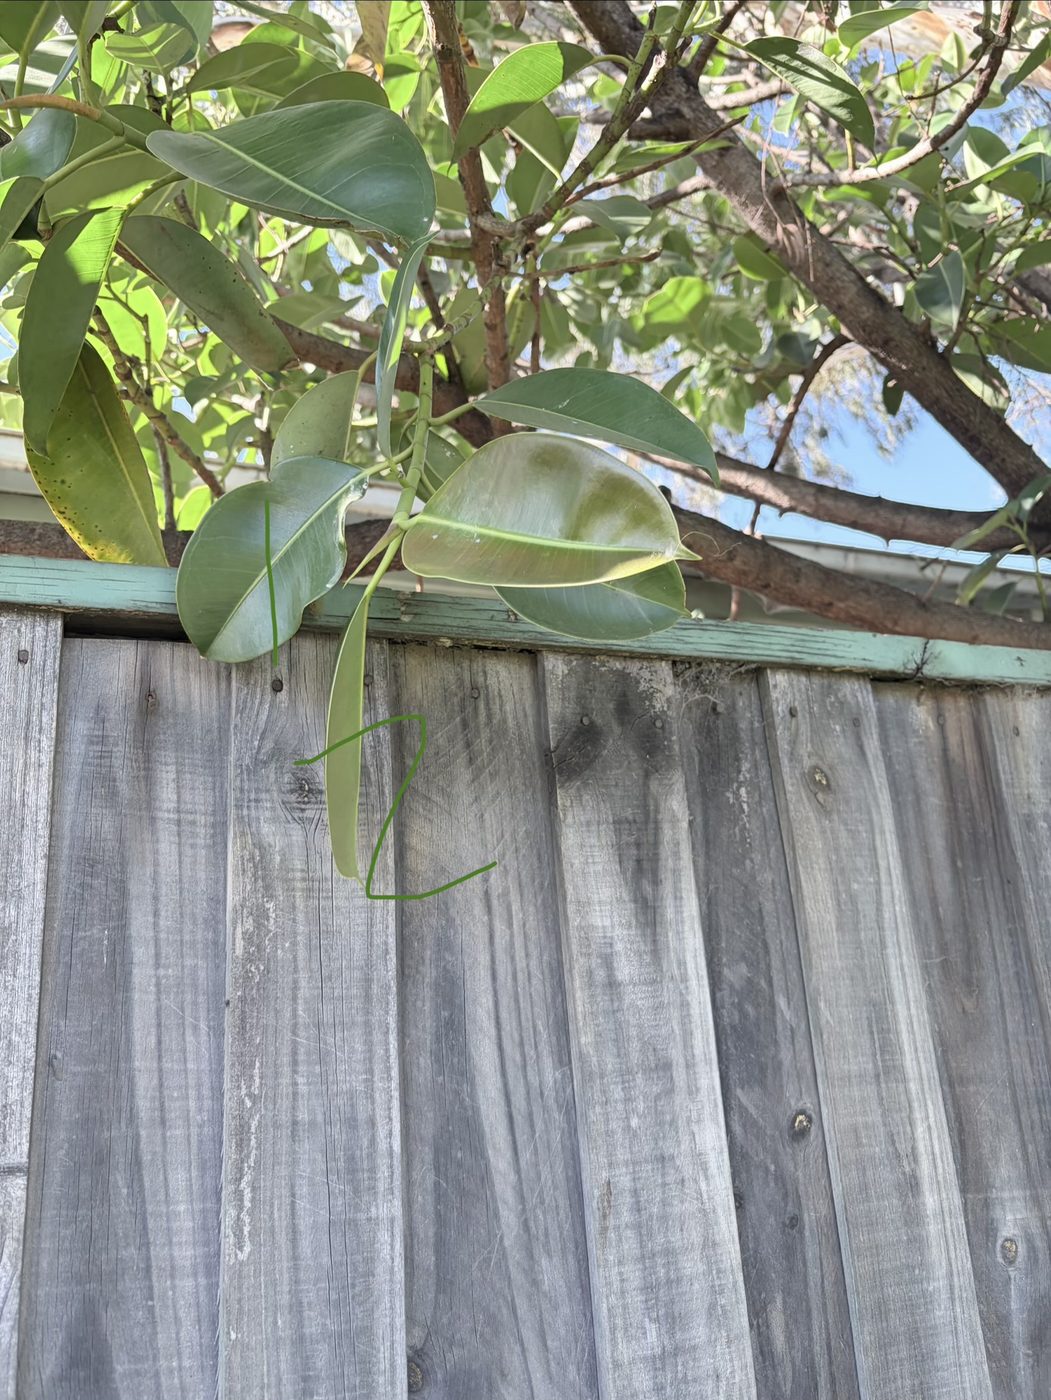
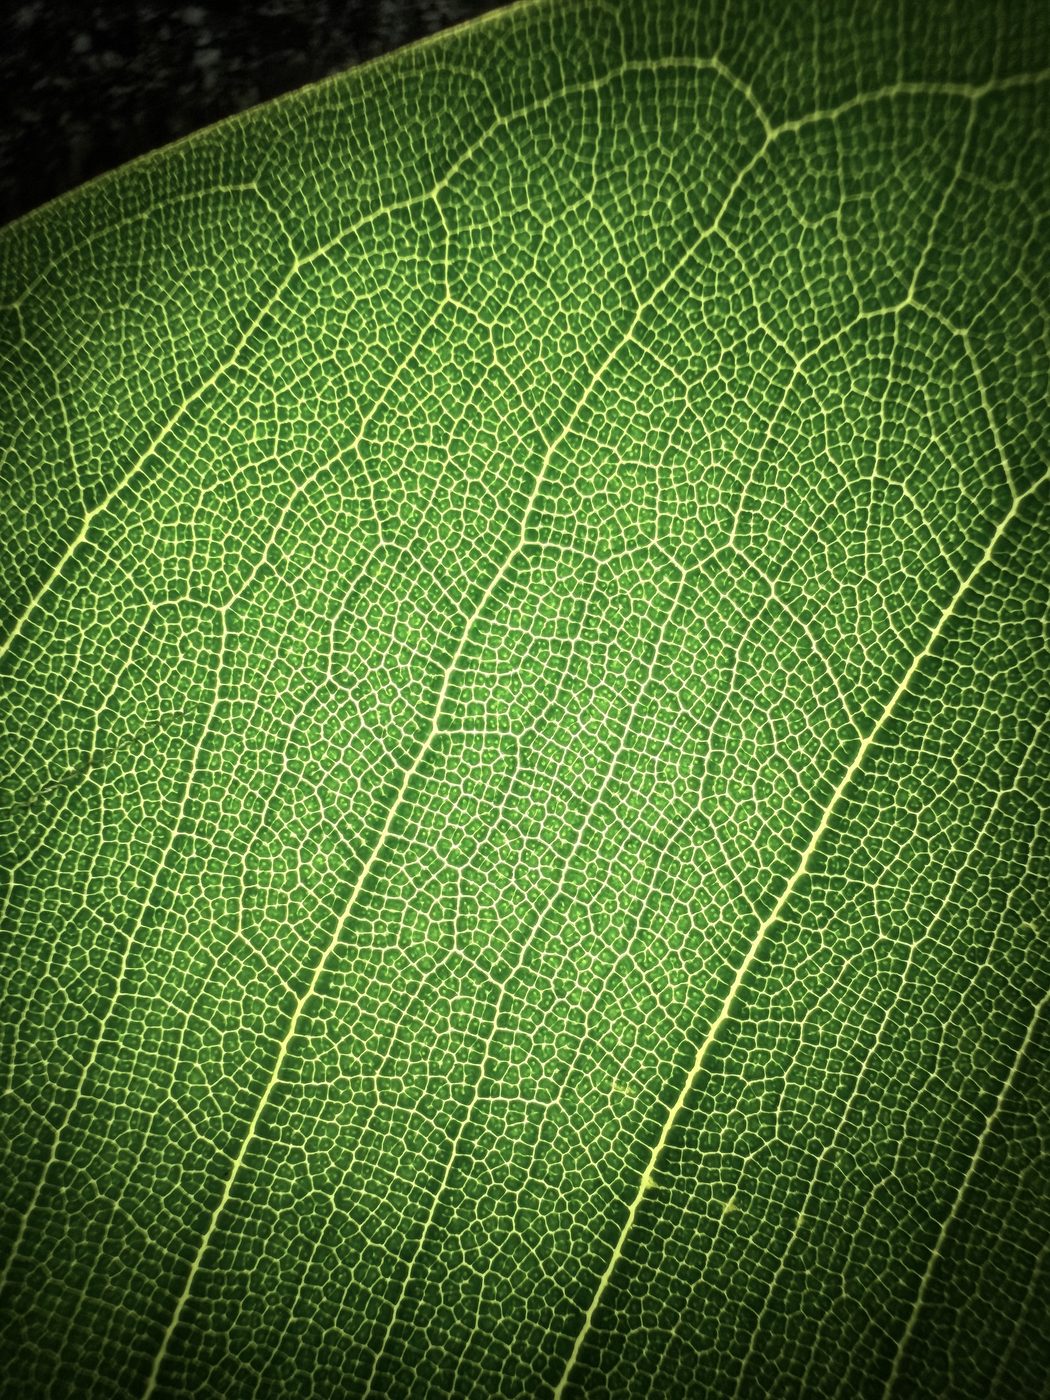
- 29 Jun – 16 AugPhase 1: field trips. Four visits to street trees
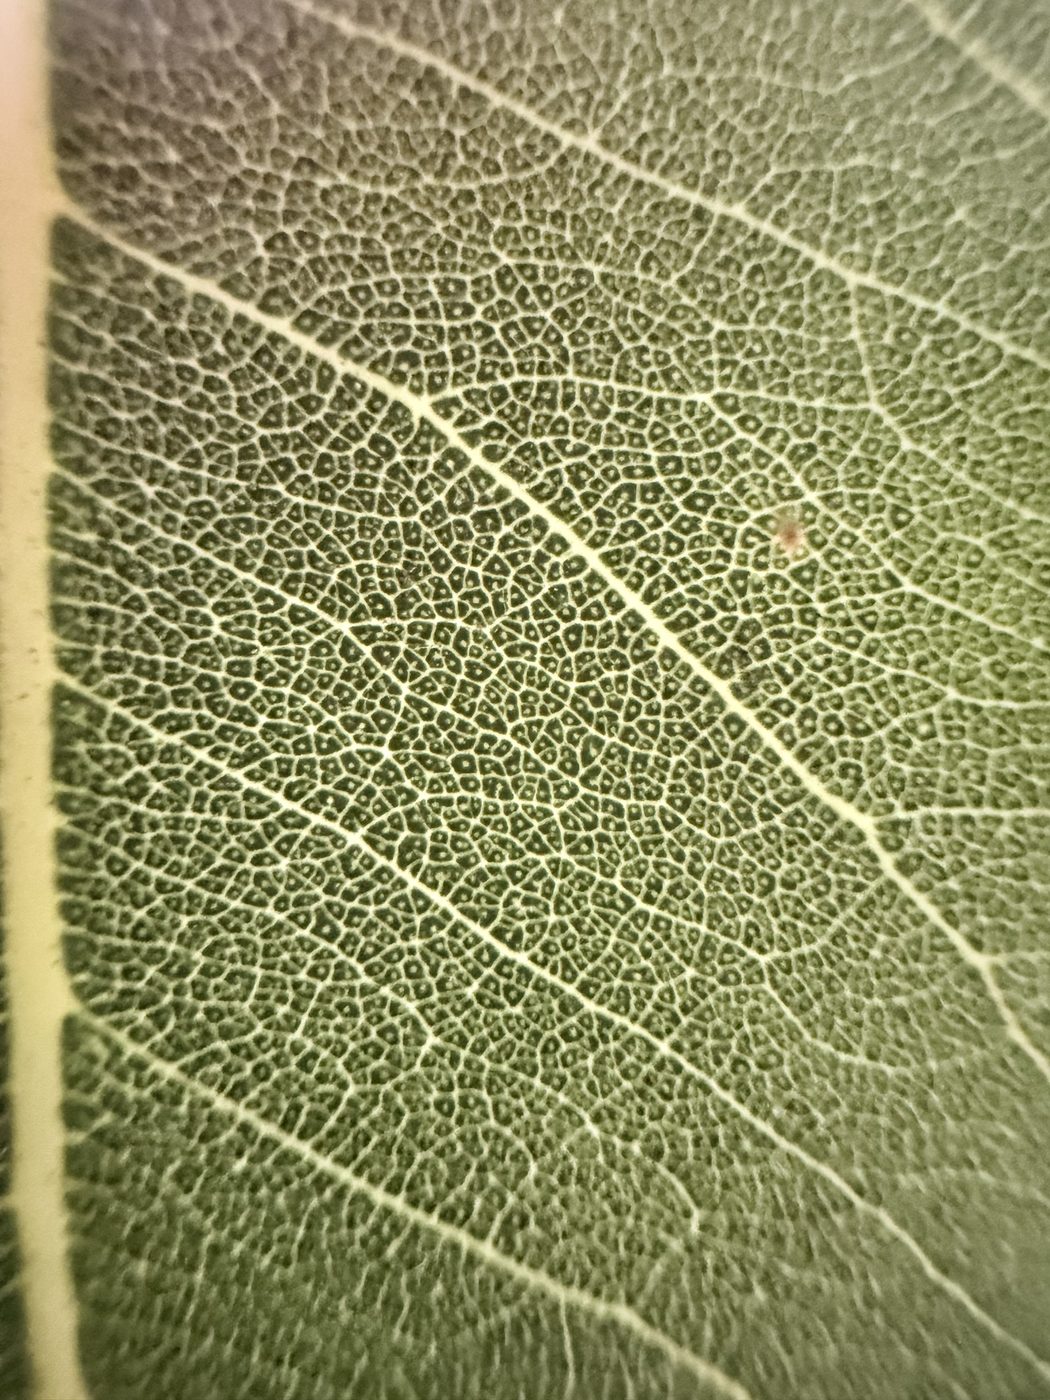
at three EPA Victoria air-monitoring sites (Alphington, Footscray, Melbourne CBD). Leaves photographed at about 10×
to count surface particles (ImageJ) and trace veins.
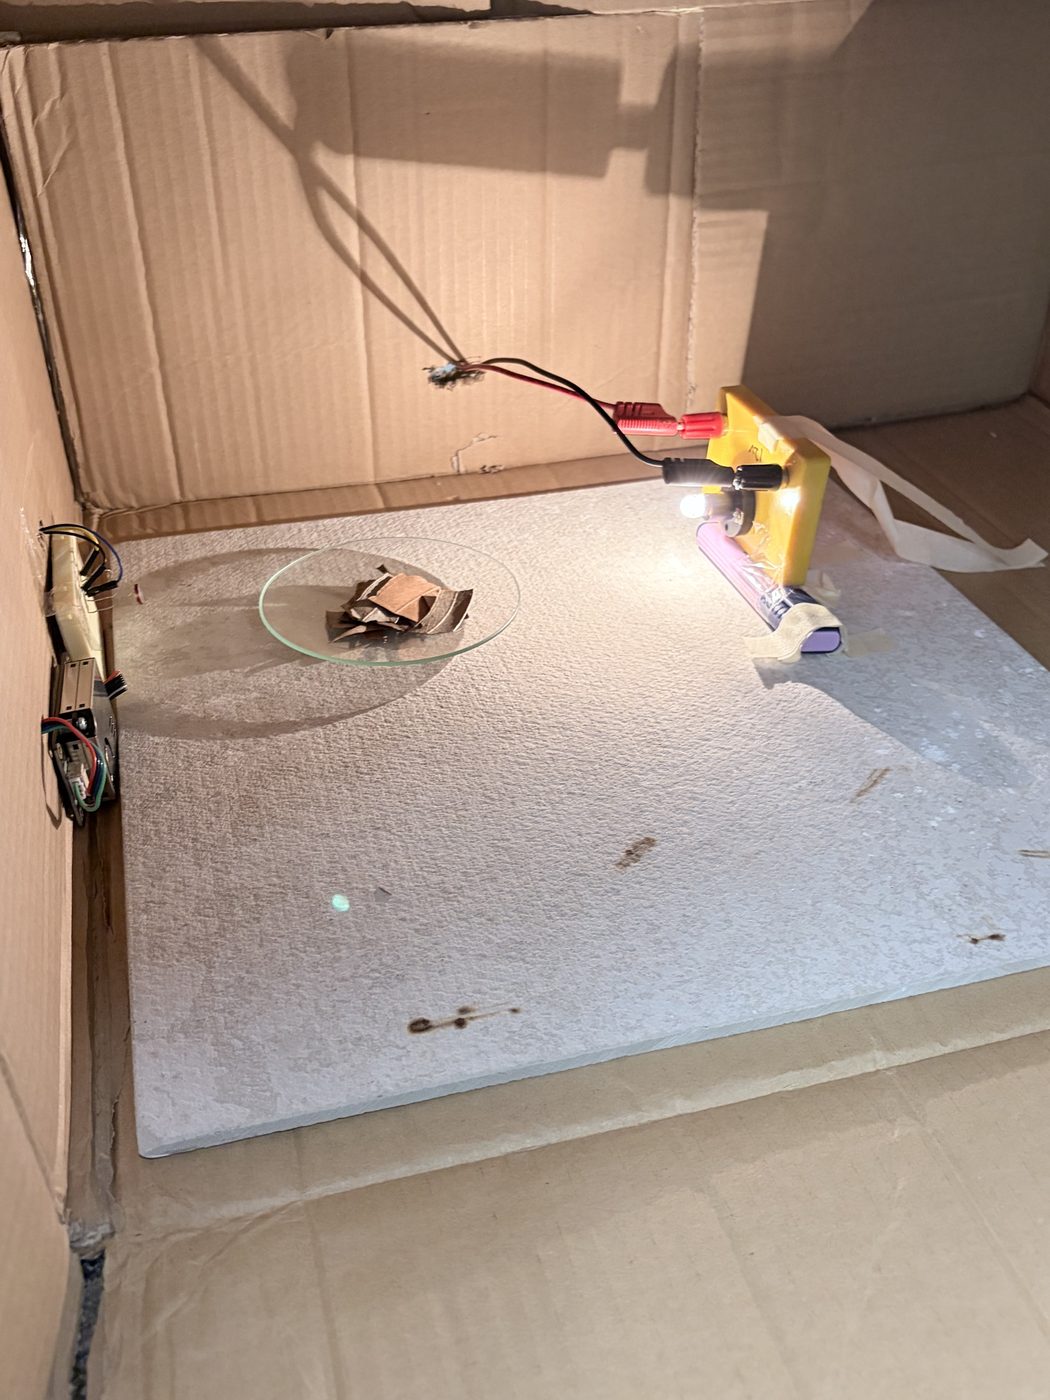
- AugustThe optical box. A light source shines across a box to a
sensor while smoke burns in a dish between them, to see how much smoke and PM 2.5 Concentration
disrupt the light.
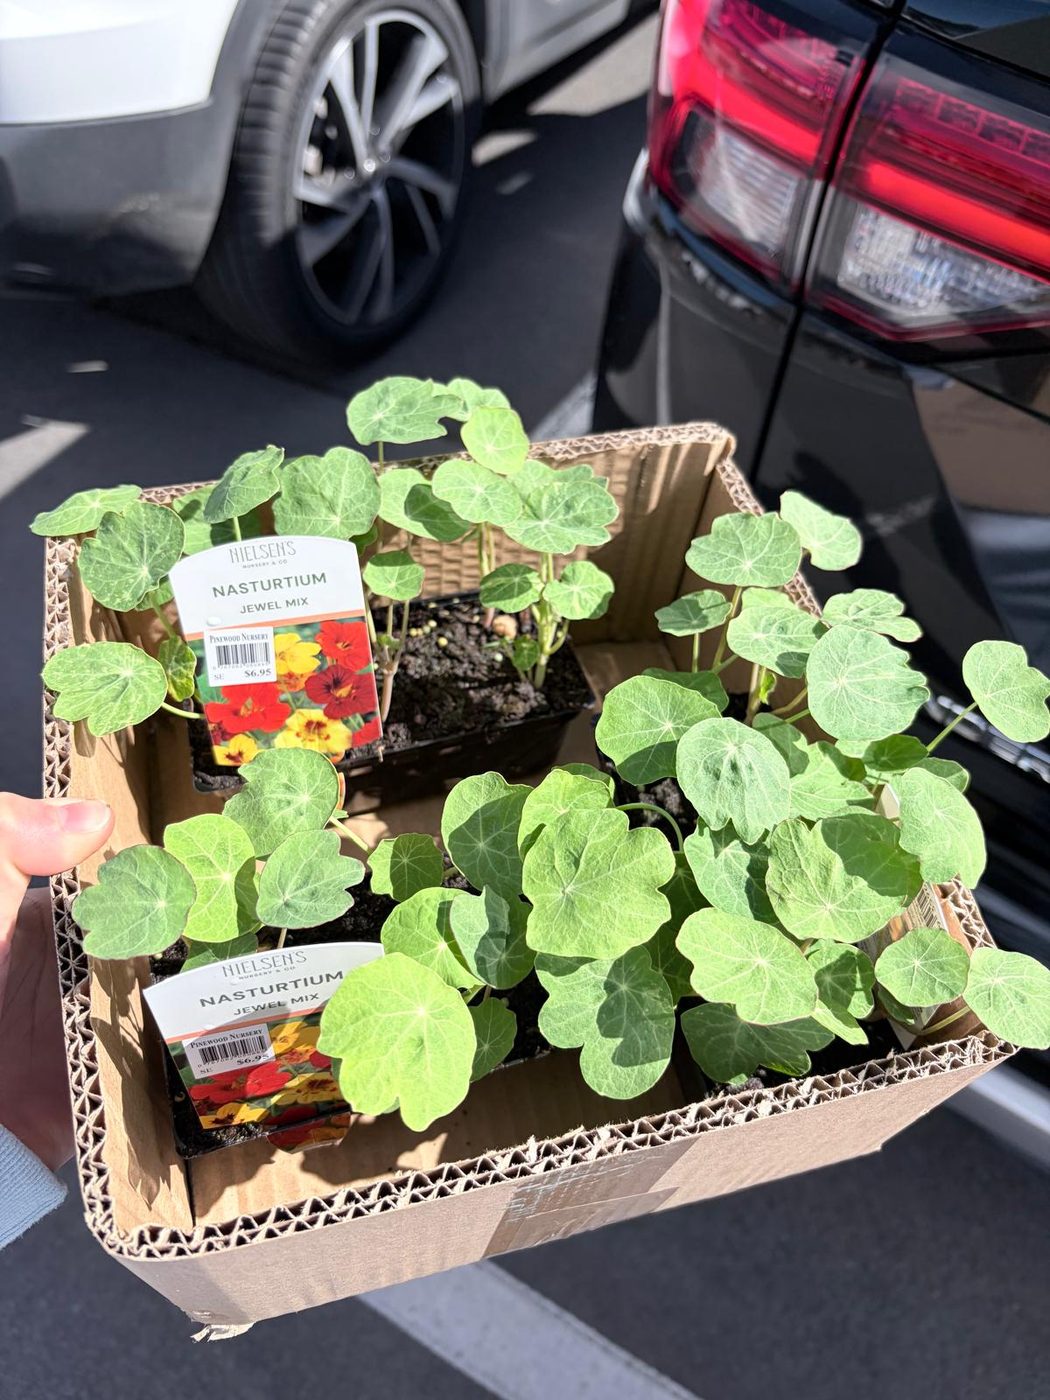
- Why we changedFicus leaves are oval with no fixed centre, and the field photos had no scale. Nasturtium's round leaf has a central hub that every landmark can be measured from, so Phase 2 moved into the lab.
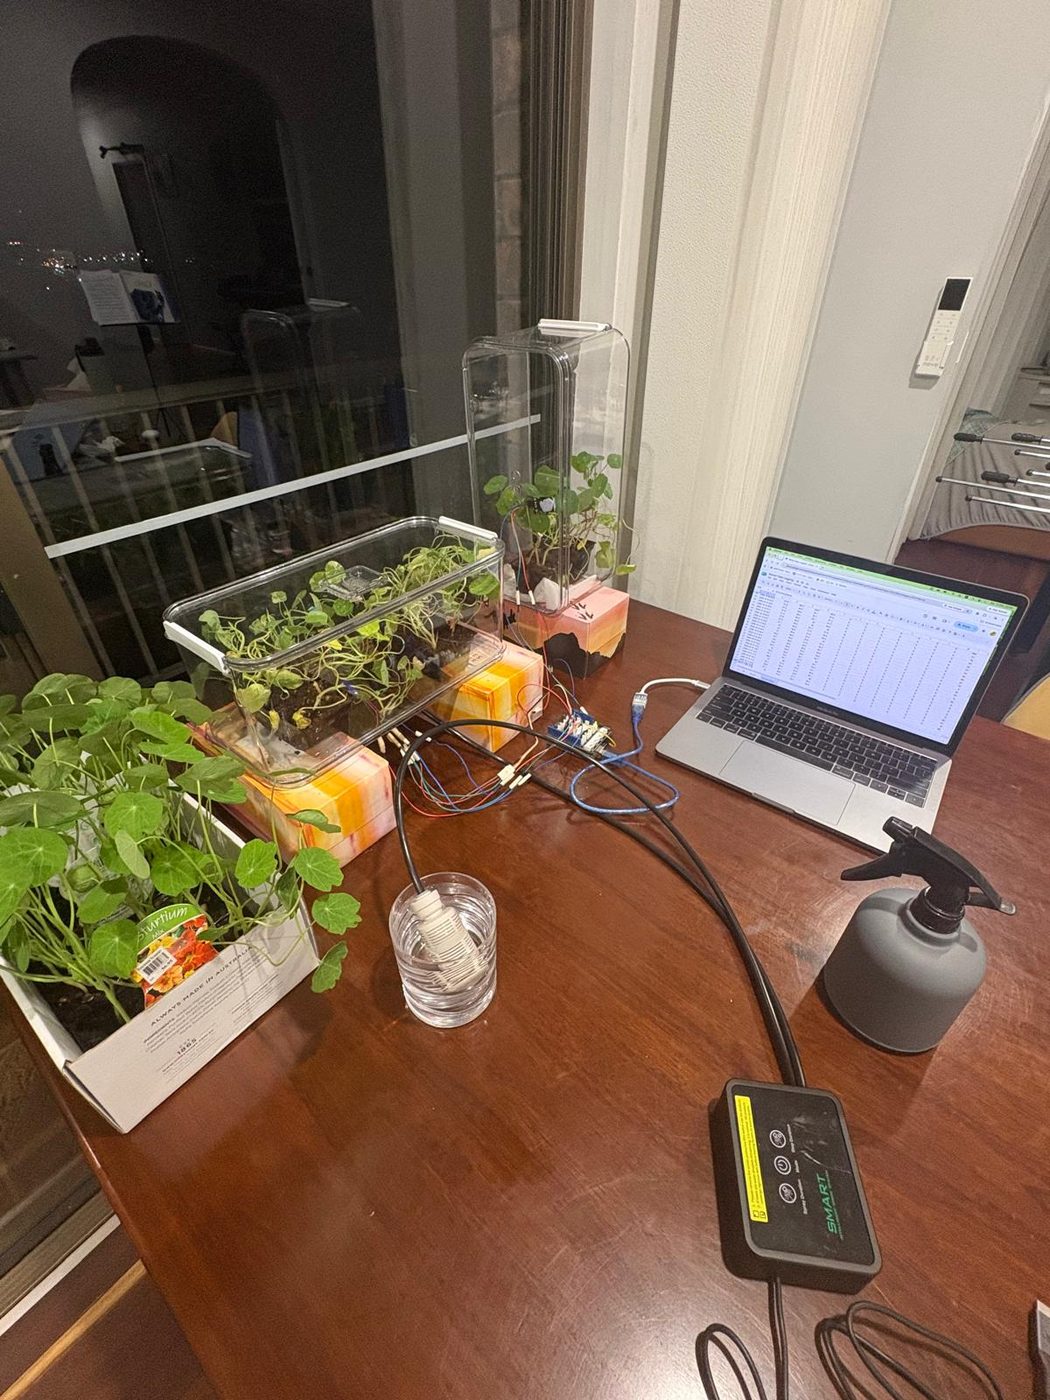
- 21 Sep – 16 OctPhase 2: two tanks, 26 days. A dry,
Melbourne-like tank and a humid, Singapore-like tank, with every tagged leaf photographed daily on grid paper
(263 photos).
- 18 OctTests written down first. Before comparing the Days 17–26 leaves, we wrote down exactly which tests we'd run, so the result couldn't be cherry-picked.
- Late OctoberLeaf Landmarks app built from our measuring code, and checked against 68 of our photos.
- In parallelNUS High: sensor simulations. Five years of weather and PM2.5 data, pollution simulated on 2 km grids, and sensor networks chosen for each city.
- NovemberJoint poster for ISSF 2026.
03Extra Results
Leaves · John Monash Science School
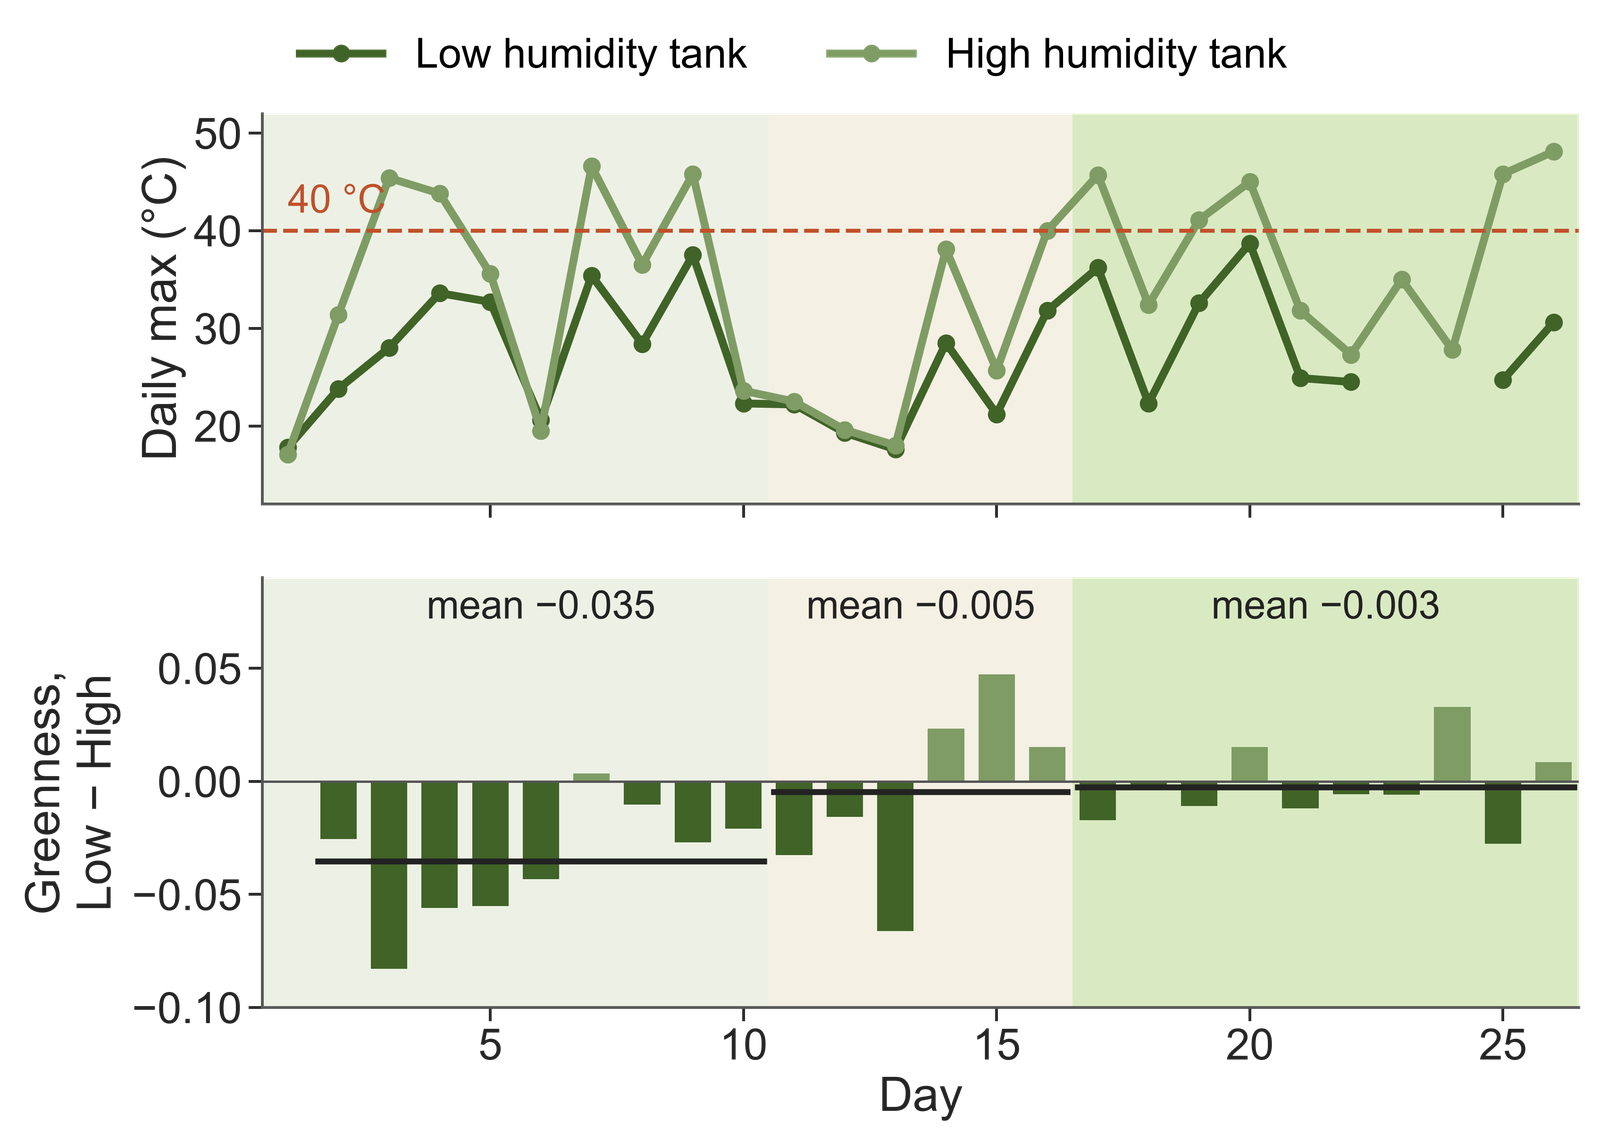
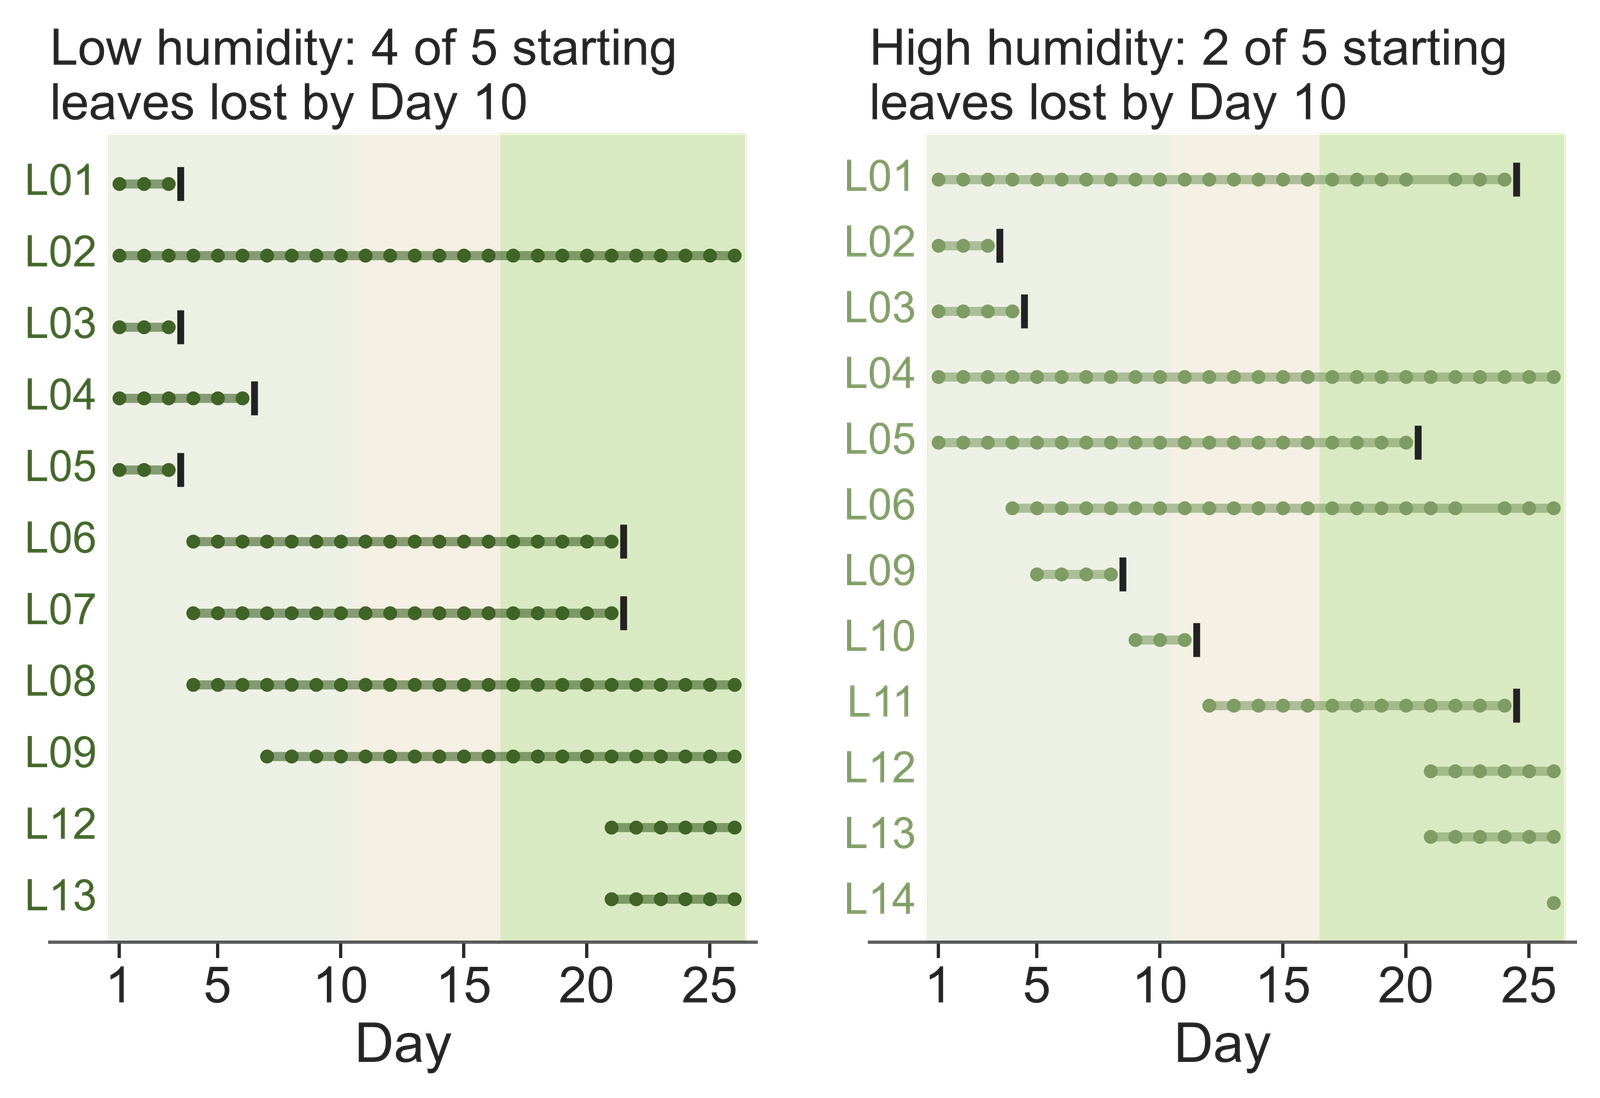
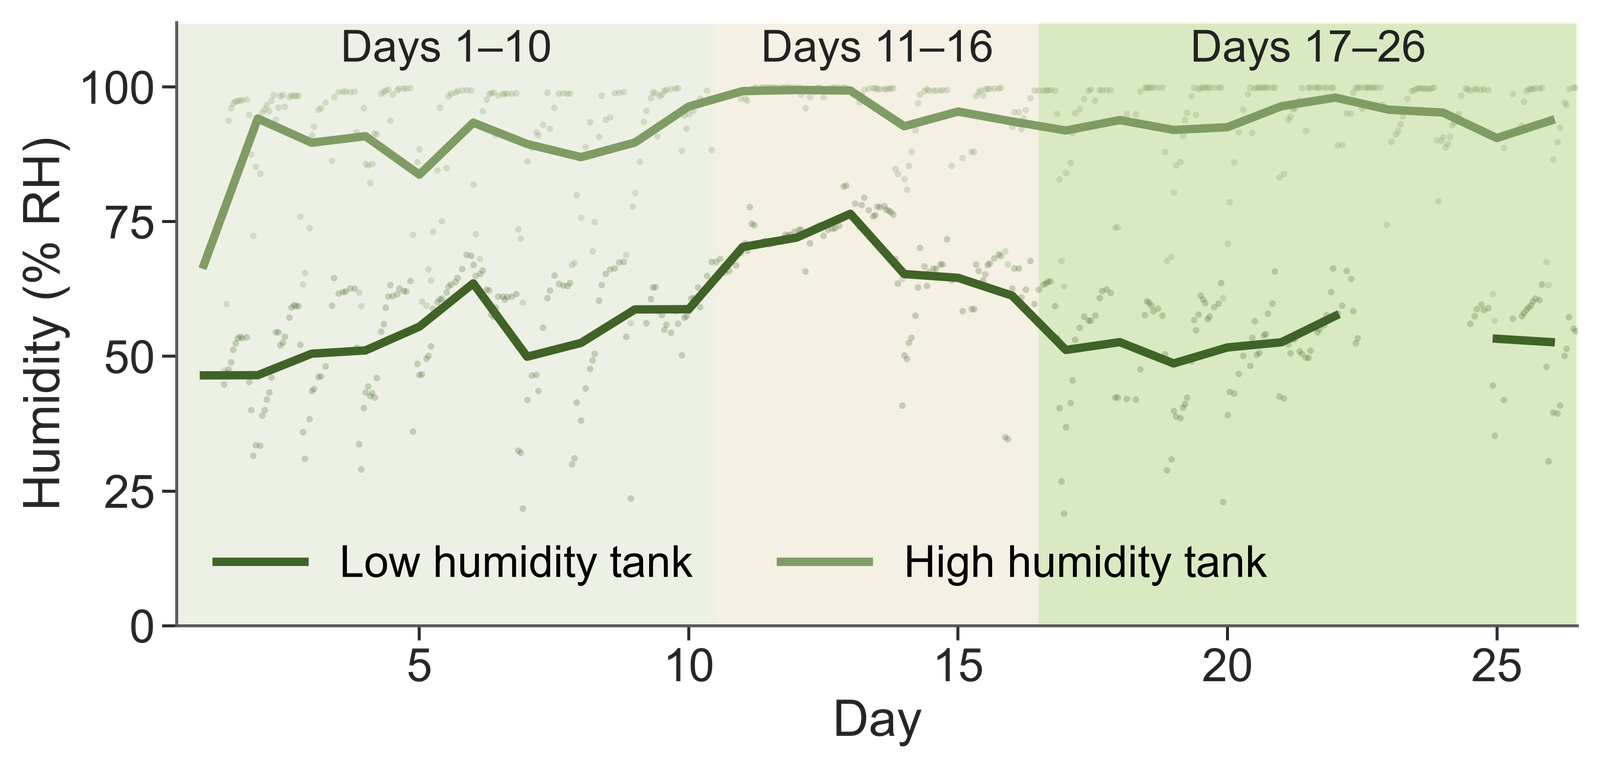
How reliable are our measurements?
- Re-measuring the same photos changed leaf shape by only 0.012 (Procrustes distance), less than one leaf changes from one day to the next (0.030) and far less than two leaves differ (0.063).
- Scales read automatically from the grid paper were within 1.35% of careful hand measurements (median of 89 photos).
- The smallest differences our Days 17–26 test could reliably detect were 0.032 in greenness, 1.2% per day in growth and 0.029 in shape. "No difference" means no difference bigger than these.
Sensors · NUS High School
NUS High's extra graphs
coming soon
coming soon
04Takeaways and next steps
What we'd do differently
- Control temperature. The humid tank also ran hotter (up to 48 °C vs 39 °C), so heat and humidity were mixed up.
- More tanks. With one tank per condition, a difference between tanks can't be pinned on humidity alone.
- Tag more leaves at the start. Replacing dying leaves (4 of 5 in the dry tank) meant few leaves were followed all the way through.
- Beat the glare. 39 of 263 leaf outlines had to be traced by hand because of glare or brown edges.
- Scale in every photo. Without a scale marker, the Phase 1 field photos could only be compared in pixels.
Next steps
- Leaves: a temperature-controlled trial at the same two humidities, and young, still-growing leaves, whose shape may respond more.
- Sensors: finer 0.5 km grids and finer wind data, especially for Singapore.
05Leaf Landmarks app
Our measuring method as a free Windows app: click a leaf's vein hub, and it finds the outline, places the 13 landmarks, reads the scale from the grid paper and measures size, shape and greenness.
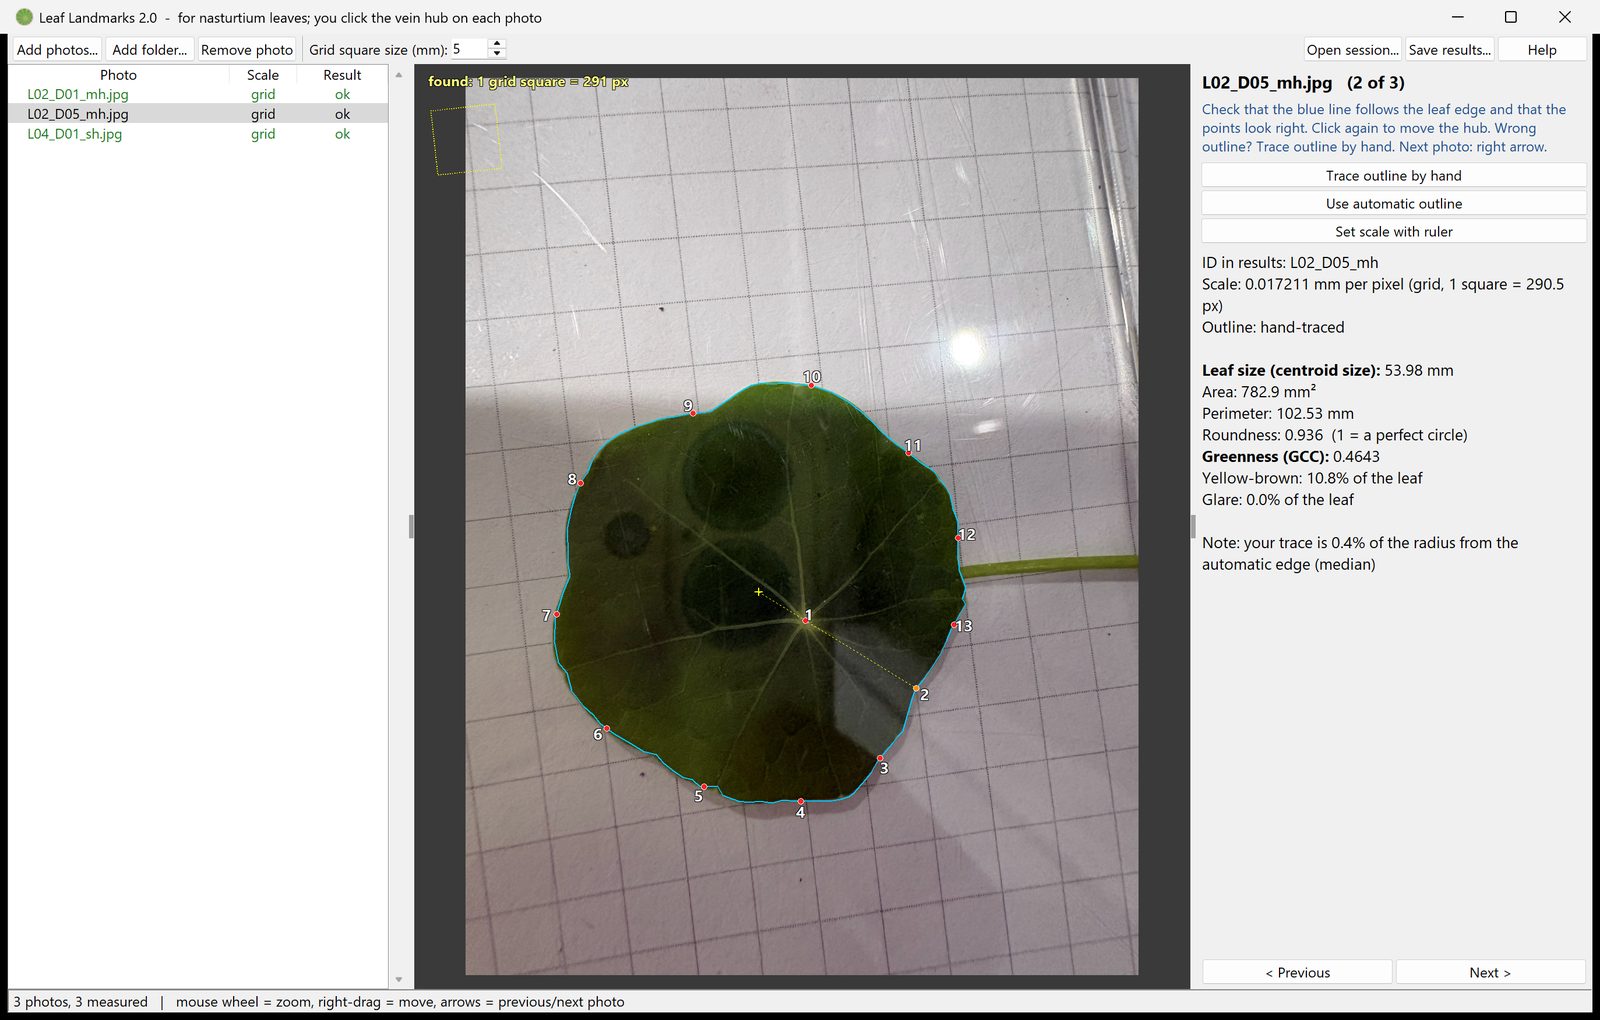
For nasturtium leaves only (for now). You click the vein hub yourself on every photo; everything
after that click is automatic.
Download for Windows · 78 MB
Read me first
Windows 10 or 11, nothing to install. If Windows says "Windows protected your PC", choose More info, then Run anyway (the app isn't signed by a company). Your photos stay on your computer.
06Data and code
Leaves · John Monash Science School
- All Phase 2 leaf data (zip)Landmarks for all 263 photos, every measurement, the planned-test results and the tank sensor log
- Analysis codePython: landmarks, scales, colour, statistics and figures
- App source codeLeaf Landmarks, and how to build it
Sensors · NUS High School
- Sensor network codeWeather patterns, pollution model and sensor placement: coming soon